Investigating Hyperelastic Behavior of 3D Printed Rubber-like Material
Tests will be conducted on an isotropic, incompressible 3D printed rubber specimen. Calibration and curve-fitting processes will then determine the material's hyperelastic properties.
106
0

Introduction
The application of 3D printing is a rapidly growing field. 3D printing is able to produce complex internal geometries, allowing for the designing of such a model which cannot be produced using traditional manufacturing.
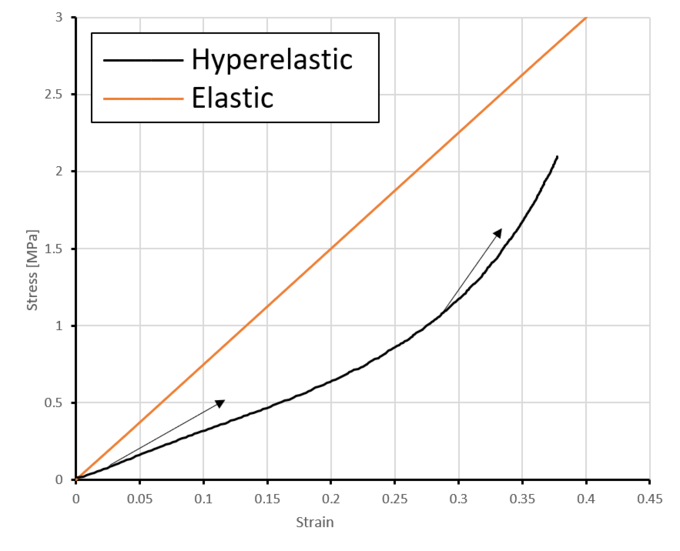
It is commonly known that different material behave differently in terms of mechanical behavior. we have seen how some materials such as metal go through elastic deformation to a point where further stresses pushes them into the plasticity regime before failure. however not all materials undergo elastic deformations that is linear in nature thus furthermore investigation are needed to determine such a rubber which is hyperelastic in nature. Meaning Hyperelastic materials are a type of material whose stress-strain response is non-linear. As we can see here from the picture showing in each few different points we have different slope value.
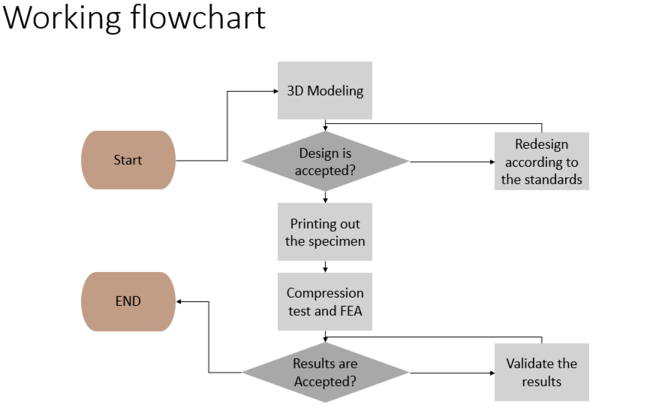
Working Flow
- Printing out the specimens: A cylindrical specimen was designed using a 3D CAD system Following ISO 7743 standard, once the design was ready, manufacturing of the product took a place by using the Lisa machine.
- Performing the compression test: An INSTRON 68TM-10 testing machine in the experiment was needed to conduct the compression tests, as a result of the compression test we were able to plot the stress-strain curves required for curve fitting.
**From Compression Test to Curve Fitting Analysis: Hyperelastic Rubber-Like Material
- Finite element analysis: The curve fitting process was performed using ANSYS 2021 R1Workbench software, finite element analysis was required to validate the accuracy of the test by performing analysis on the specimen to compare it with experimental data.
Results
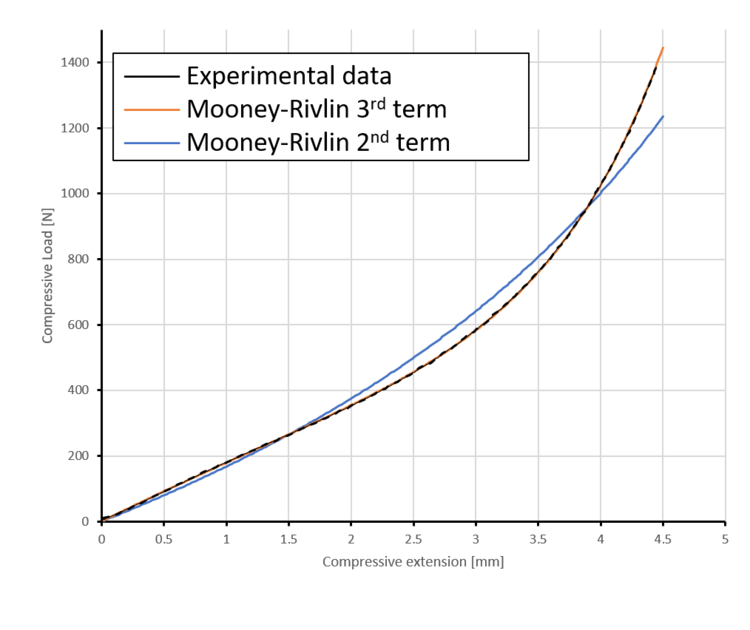
A set of date obtained from the analysis used to compare the simulation results with the experimental data to ensure the accuracy.
Not all results are presented in the curve. I only show the best and the worst results to help understand the idea. However, from the calculation of the percentage of error between the experimental data and hyperelastic material models, it can be seen in the figure below how accurately and perfectly the result for MR3 matched with the experimental data. This indicates that the validation of accuracy using FEA was well performed, and we obtained a real parameter expressing the hyperelasticity of our printed material. Meanwhile, we can observe that the blue line representing MR2 has a percentage error of 8.17%.
Discussion and Conclusion
To fully understand the hyperelastic behavior of a rubber-like specimen, it is necessary to conduct three different tests: uniaxial tension, shear, and biaxial tests. Relying on a single test mode may fail to determine the true material behavior, as different modes capture different aspects.
The lack of material parameters can result in unsuccessful curve fitting to experimental data. However, as we have observed earlier, the Yeoh 3 and MR3 models demonstrate higher accuracy. Linear equations can solve a line, but a parabola requires a second-order equation for accurate determination.
Based on the data and the error percentage for complex geometries, MR3 is the closest model that can indicate the behavior. However, it is important to assess the reasonableness of the results. Generally, a 0.80% error percentage is considered very good. I was initially expecting a range of 5% to 10%, but the reason for the lower number is attributed to several factors:
- The ideal frictionless contact between the platens and the rubber specimen introduces minimal error.
- The presence of friction in the experimental data adds to the error value.
- The barrel effect maintains a consistent contact area, resulting in minimal stress value changes that might introduce additional error.
- Slight discrepancies in the dimensions of the specimen between FEA and experimental measurements contribute to adding or subtracting values, affecting the overall accuracy.