Sensor-Based Measurement Technologies
The purpose of this project is to learn about the operation and main characteristics of various types of sensors, such as inductive, capacitive, temperature, photovoltaic, strain gauge, and optical sensors. The project aims to provide a comprehensive understanding of sensor technology and how it can be applied in various industries and applications by investigating the unique properties and capabilities of each sensor type.
97
0

Inductive proximity sensor testing
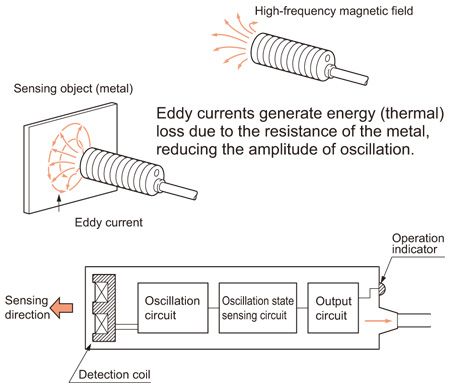
How Inductive Sensor work?
The eddy current generated in the conductor has the opposite direction of the magnetic flux density from the sensor, which leads to a loss of energy in the electric circuit. As a result, the change in oscillation will be detected by the circuit, causing it to supply more energy and increase the current flow. This enables us to determine the presence of an object within the sensor range.
Measuring method:
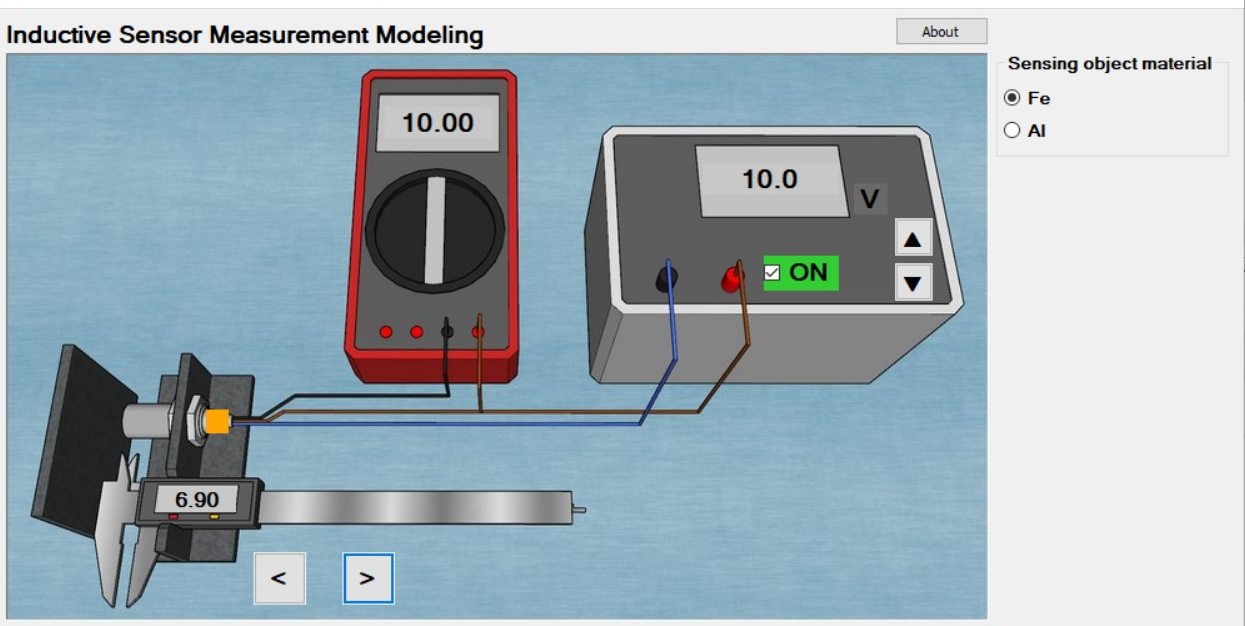
When you turn on the power supply for the first time, you will notice that the digital voltmeter displays no readings (0 volts). This is the value of Vout1 when there is no object present. Record this value in the table as the baseline reading for all other materials that will be tested for changes.

To start the material detection process, click on the right side of the software interface to move the materials towards the sensor side. Continue this process until the orange light on the system turns on, as indicated in Figure. The orange light signifies that the sensor has started detecting the materials. When the orange light turns on, you will notice that the Digital Voltmeter displays a reading that is the same or close to the power supply input voltage. This reading is known as the Vout2 value. Record it in the table. At the same point where the orange indicator turns on, read the value of the Distance Indicator. This value is also known as the distance indicator (Dstanice I). Record it in the table. Repeat this process for all different materials, including inductive materials.
Results :
As a result of this experiment we can say different material has different activation range depends on the conductivity, and ferromagnetic of the metal which can be seen in the following table.
*Uout1: output voltage no object
*Uout2: output voltage with object detected
-----------------------------------------------------------------------------------------------------------------------------------------------------
Capacitive proximity sensor testing
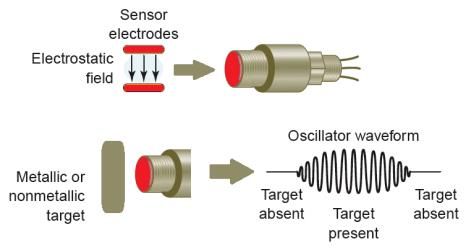
How Capacitive proximity work?
The sensor generates an electric field at the sensing surface. When a target approaches the sensing surface, it enters the electrostatic field of the electrode and changes the capacitance of the oscillator. As the target moves away from the sensor, the oscillator's amplitude decreases, returning the sensor to its original state. The electric field can detect air/vacuum, which has a permittivity value of zero. Once a target passes within the sensor range, the permittivity of the air will no longer be the same as that of the vacuum.
Measuring method:
When you first turn on the power supply, you will notice that the digital voltmeter displays no readings (0 volts). This is the Vout1 value when there is no object present. Record this value in the table as the baseline reading for all other materials that will be tested for changes.

To begin the material detection process, click on the right side of the software interface to move the materials towards the capacitive sensor side. Continue this process until the orange light on the system turns on, as shown in Figure. The orange light indicates that the sensor has started detecting the materials. When the orange light turns on, you will notice that the Digital Voltmeter displays a reading that is the same or close to the power supply input voltage. This reading is known as the Vout2 value. Record it in the table. At the same point where the orange indicator turns on, read the value of the Distance Indicator. This value is also known as the distance indicator (Dstanice I). Record it in the table.

Results :
Based on the results of this experiment, we can conclude that different materials have different activation ranges depending on their permittivity. Permittivity is a measure of the electric polarizability of a dielectric material. A material with high permittivity will polarize more in response to an applied electric field than a material with low permittivity, thereby storing more energy in the material. In electrostatics, permittivity plays an important role in determining the capacitance of a capacitor, as shown in the following table.
-----------------------------------------------------------------------------------------------------------------------------------------------------
temperature sensors (Pt100, thermistor, thermocouple)
What is the different between the mentioned sensors?
How temperature sensors work?
generally we have two types in which the collecting data will be depending upon.
PTC : Positive Temperature coefficient
The resistance of metal typically increases as its temperature increases and that was because the atoms started to vibrate which makes it harder for an electron through material without colliding.
NTC : Negative Temperature coefficient
With semiconductor there is one or too many electrons in the outer shell for it to be a conductor so it will behave like an insulator and if we heated the material up some electrons will gain enough energy to make the jump and break free from the atom as more heat is added, more electrons move from more atoms, and so the material's resistance decreases accordingly.
Measuring method:
As shown in the figure below, the model includes three temperature sensors: thermocouples, thermistors, and Pt-100s. Additionally, there is a heating chamber, a 60 V power supply, and a reference thermometer to indicate the current temperature. To begin, turn on the power supply and allow the heating chamber to heat up. Monitor the thermometer indicator and start filling out the table below with the temperature range of 30°C to 100°C, along with the readings from the different sensors.

Results:
As a result of this experiment we can say different sensing technology has different result which can be seen in the following table.
- The graph of the thermocouple indicates an increasing function, meaning that as the temperature increases, the voltage output of the thermocouple also increases proportionally.
- On the other hand, the graph of Pt100 is slightly more complex. It shows an increasing and constant function with a slow rate of resistance increase as the temperature rises.
- The thermistor graph is also an increasing function but with a concave-up curve. It starts at a point of 10 kilo ohm’s and ends at 21 kilo ohm’s as the temperature increases.
-----------------------------------------------------------------------------------------------------------------------------------------------------
Photovoltaic sensor testing
How photovoltaic sensor work?
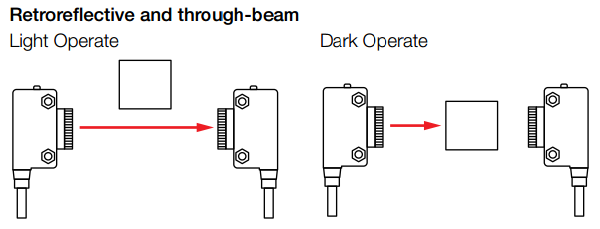
Solar Photovoltaic (PV) cells generate electricity by absorbing sunlight and using that light energy to create an electrical current. solar panel works by allowing photons, or particles of light,to knock electrons free from atoms, generating a flow of electricity. It is operated by the use of an emitter which transmits a beam of light to the receiver, When the light is normally being received it is known as a dark operated mode when the absence of light is required it known as light operated mode.
Measuring method:
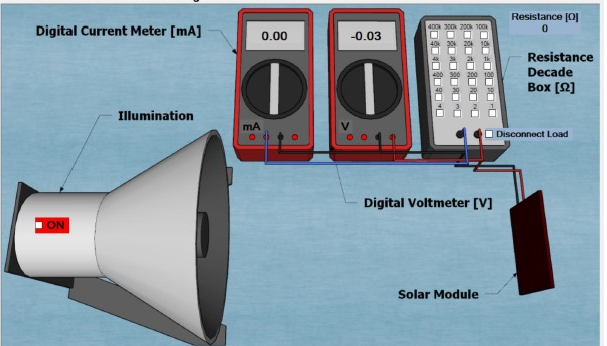
To perform this experiment, I will first turn on the illumination towards the photovoltaic solar cell. At this point, the circuit will be open as it is not connected to any load, such as a resistor. I will then measure and record the values indicated by the ammeter and voltmeter, and then calculate the power generated by the solar cell.
Results:
As a result of this experiment we can say the higher the resistance the higher the voltage the lower the current according to ohms law.
- In the open circuit the current cannot flow from one end of the power source to the other. Because of this there is no current flow, and therefore the light does not turn on.
- A short circuit is defined as a connection between two nodes that forces them to be at the same voltage. In an 'ideal' short circuit, this means there is no resistance and thus no voltage drop across the connection. In real circuits,the result is a connection with almost no resistance.
-----------------------------------------------------------------------------------------------------------------------------------------------------
Strain gauge sensor testing
How stain gauge Sensor work?, Measuring method:
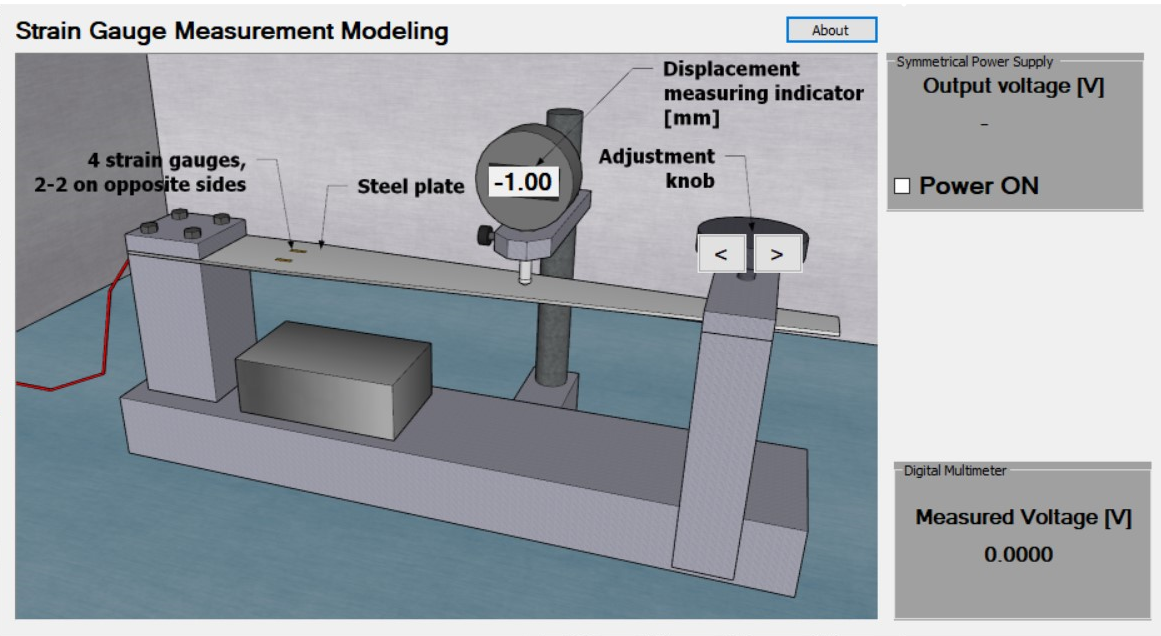
As we can see in the diagram, we have four strain gauge sensors. Two of these sensors are placed on the top of the metal sheet and the other two are placed on the bottom. Additionally, there is a deflector or displacement measuring indicator, as well as an adjustment knob. By changing the adjustment knob, we can apply force on the metal sheet and slowly bend it. As more force is applied, the metal sheet will bend more, which will also bend the strain gauges that have been placed on it. This bending of the strain gauges will cause a change in their resistance, which in turn will result in a change in the output voltage.
To start the measurement turn on the power supply, adjust the force till deflector (displacement measuring indicator) reads Zero (0) mm displacement then read the measured voltage (Uout in the table )and write the measured voltage value to the table below, then again apply a force by clicking on adjustment knob till you read 0.1 mm displacement see figure.
Results:
using of the following equations
- Power supply: 5 V +-
- Bridge voltage: Ub = 10 V
- gauge factor g = 2.05
- stamp resistance: R = 120 Ohm
- to calculate ΔR/R in the table use this question Output voltage: Uout = Ub* ΔR/R
- Relative resistance change: ΔR / R
- Specific strain (Δl / l)=Ɛ = (ΔR / R)/g
- gauge factor g = (ΔR/R) / (Δl / l).
As a result of this experiment we can say when a strain gauge is compressed, its electrical resistance decreases and when it is stretched its resistance increases.
-----------------------------------------------------------------------------------------------------------------------------------------------------
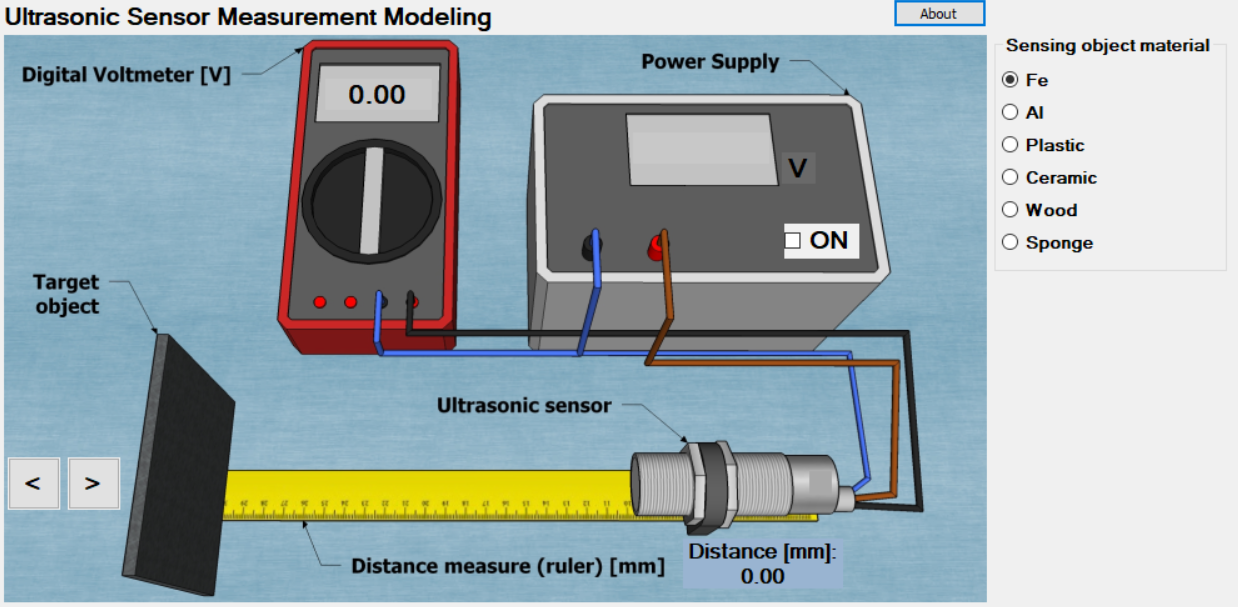
Ultrasonic proximity sensor testing
How Ultrasonic Sensor work?
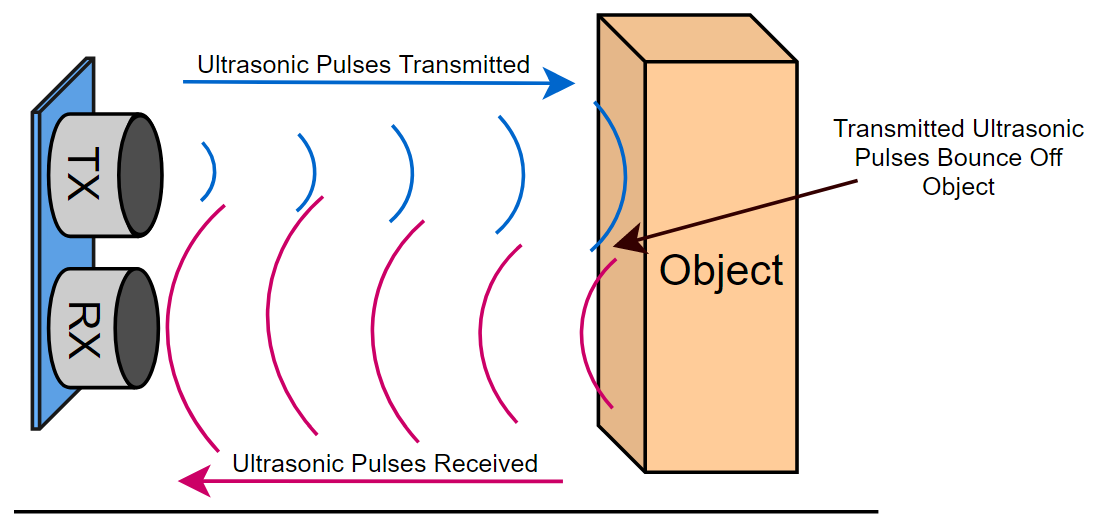
Ultrasonic sensors employ high-frequency sound waves that are typically above the human hearing range (20 kHz or higher). The sensor sends out a short burst of sound waves, which travel through the air until they come into contact with an object. The sound waves that strike the object reflect back to the sensor. The sensor then detects the reflected sound waves and time how long it takes them to return.
Measuring method:
To utilize an ultrasonic sensor in a measurement, the first step would be to activate the sensor and initiate the emission of high-frequency sound waves. The emitted sound waves will then travel towards the object being measured, and the sensor will detect and record the time it takes for the sound waves to bounce back to the sensor. The distance to the object can then be calculated using the speed of sound and the time taken for the sound waves to travel to and from the object.
Once the distance is measured, the sensor can also detect the presence of the object based on the strength of the reflected sound waves. This information can be recorded and analyzed to make decisions or automate processes in various fields, such as robotics, automation, and automotive systems.
Results:
As a result of this experiment we can say different materials have different frequencies and different sensing distances, also materials with lower frequency will have a higher switching distance as it can been seen in the table.