A Comparative Analysis of Earthquake Response to Historical Events
This project aims to analyze the earthquake response of a four-story building using ANSYS software and compare it with historical earthquake data from Turkey and El Centro.
101
0

Introduction
Earthquakes are among the most damaging natural disasters that can strike a place. They inflict severe infrastructural damage and can lead to loss of life and property. To reduce the impact of earthquakes, it is critical to understand how buildings and structures respond to seismic activity.
Objectives
Based on historical earthquake data, the goal of this research is to evaluate the seismic performance of a four-story building and decide whether it will sustain earthquake forces. This analysis will provide significant insights into the building's behavior during an earthquake and will aid in the identification of any potential structural problems that must be remedied.
Method
The ANSYS program will be used to simulate the four-story building's response to seismic activity. The software use finite element analysis to simulate the behavior of the building in various earthquake situations. Historical earthquake data from Turkey and El Centro will be utilized to generate earthquakes with characteristics comparable to those seen in the past. The simulation will be dependent on characteristics such as the earthquake's severity, duration, and acceleration.
Data collection
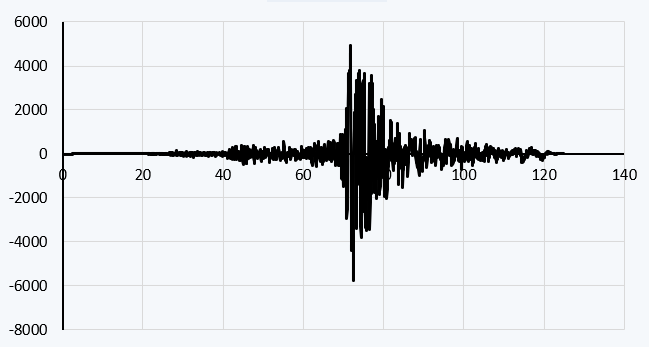
The data was collected for the studies based on third party resources, i am not really sure the accuracy of data related to turkey event that is acutally the terrifying earthquake happened recently.
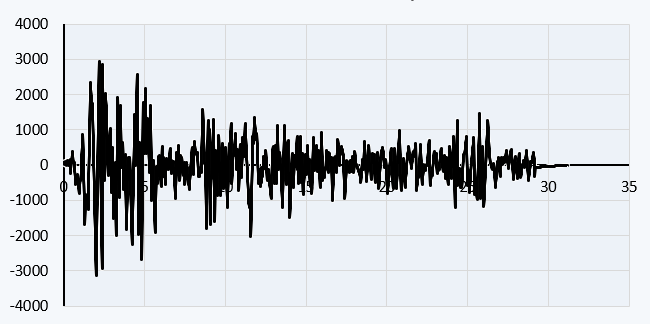
El Centro chart
Turkey chart whole span
Turkey chart ( Peak only )
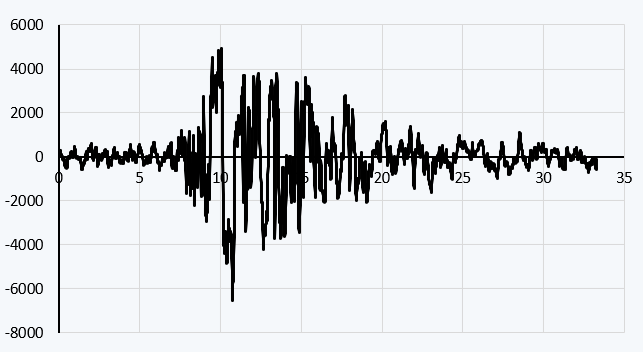
** The reason behind( peak only ) data due to the huge data available as a result of small time interval. 'Less data easy simulation'
Types of Analysis
Modal analysis: is the process of estimating a structure's natural frequencies and mode shapes. This is useful for determining how a structure will behave to different forms of loading and for identifying potential areas of resonance or instability.
Transient analysis: involves modelling a structure's dynamic reaction to time-varying loads or boundary conditions. This can help forecast how a structure will respond to things like earthquakes, wind gusts, and other sorts of transient stress.
Random vibration analysis: is the practice of modelling a structure's reaction to random, non-periodic loads. In the aerospace and automotive industries, this form of study is often used to test the durability of components and systems under random vibration loading.
Response spectrum analysis: involves simulating the dynamic response of a structure to seismic or other types of ground motion using a preset set of acceleration, velocity, or displacement response spectra. In earthquake engineering, this type of study is often used to assess the seismic performance of buildings and other structures.
** Since we have the data in the form of mm/s^2 not in Hz we best to work with Transient analysis and of course modal is essential for all.
Modal Analysis
12 modes were extracted and the nature frequency of the structure shows really low frequency range between 1.48 [Hz] to 17.58 [Hz]. However, in order to fully capture all shapes modes we need to look at what we call it the Ratio of Effective Mass to Total Mass this value determine the percentage of the deformation in each direction individual. 0.8 out of 1.0 is enough to know our modes extracted were enough.
Our study scope is earthquake analysis. The vibration caused by earthquakes typically goes back and forth in the x-direction, so we need to focus on the natural frequencies that have the greatest effect on this direction. We can determine this by looking at the ratio of effective mass to total mass.
Mode 1, with a frequency of 1.48 Hz, has a value of 0.82 out of 0.99, indicating that this is the mode we need to focus on.
Transient analysis
As I suggested earlier, since the vibration of the earthquake travels in the direction of the x-axis and mode 1 is almost in the x-direction, we will see that there is no significant difference between the total deformation and the deformation in the x-direction.
Total deformation:
X-direction deformation:
Following the same method we can fill out the following table:
Discussion
The maximum value over time does not account for the system's dynamic effects and only returns the maximum value that occurred over the full time period. Overtime resonances might cause the maximum value over time to diverge from the results of a transient examination.
**Further analysis for the stress build in the system might take place in the future.